Classifying shots in tennis using a Wearable
This article discusses a fun project I had: Creating a wearable device that could classify tennis shots. For this project I just looked at classifying forehands and backhands. Check out a commercialized video of the project below to see it in action!
Device Used
I used MbientLab's MetaWear CPro - an IMU unit that could stream gyroscope, accelerometer, and magnetometer data over bluetooth. It also had a built-in battery and a micro-USB port for charging.
Note: IMU stands for inertial measurement unit. It is a combination of sensors that measure acceleration, angular velocity, and magnetic field. Most smartwatches all have this capability.
Collecting Training Data
The data collected was the raw gyroscope, accelerometer, and magnetometer against time for forehands and backhands. I collected the data one night from my local tennis club. I had players wear the IMU band while I streamed the data to a laptop. I had them hit 10 forehands and backhands and manually clicked to record and classify the shot while they were playing.
Analyzing the collected data
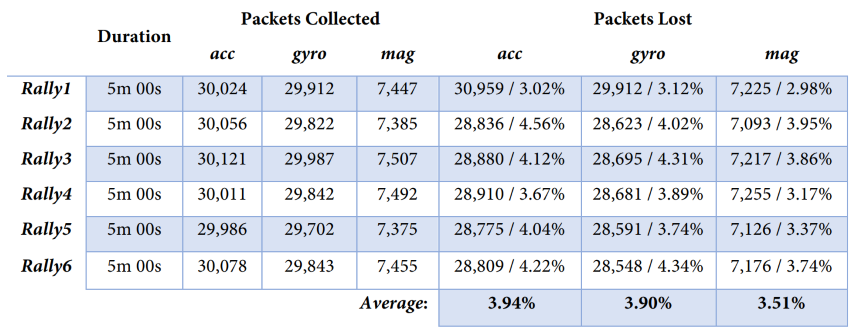
First, to ensure data collected was consistent, the data being streamed off the device was measured for packet loss. The operating sample rates for the MetaWear CPro were 1600Hz (accelerometer), 1600Hz (gyroscope) and 25Hz (magnetometer) and found to have a packet loss of ~4% over bluetooth - which was minor enough at such high operating frequencies to continue.
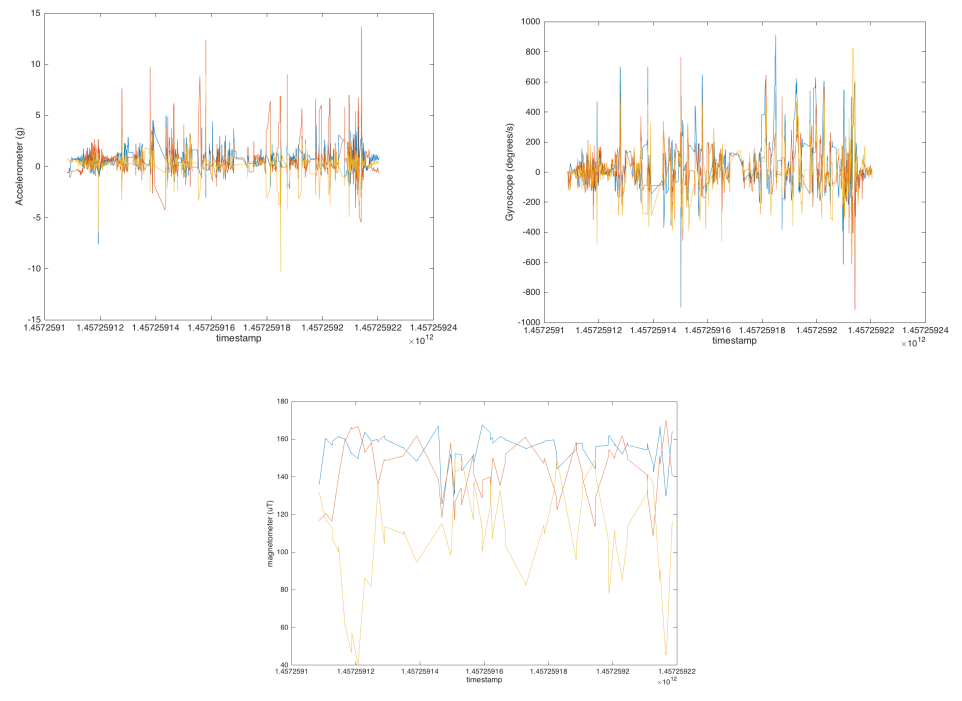
Next, I wanted to see how the data looked when plotted. Here is the accelerometer, gyroscope, and magnetometer data of a rally plotted against time.
Smoothing noisy data
The data was noisy, so I compared some common smoothing algorithms to see what results I could get.
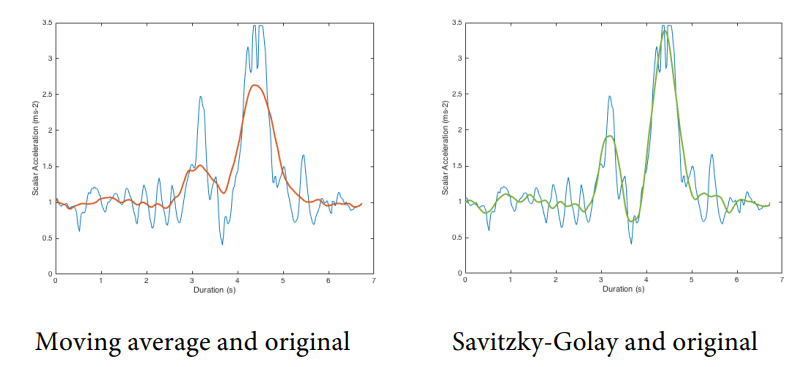
Ultimately the Savitzky-Golay filter gave the most pronounced signal-to-noise ratio while not over-smoothing the data, so I applied that to the data going forward for the rest of the project.
Shot Detection
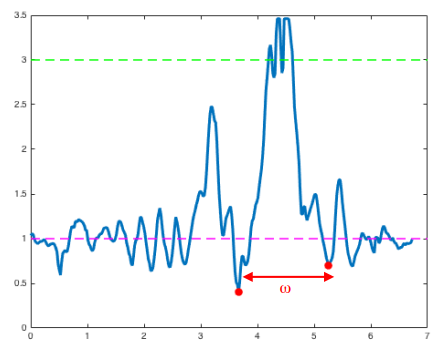
The first step in shot recognition was to detect what was a "shot" from the IMU data, i.e. what window of data corresponded to a forehand or a backhand vs the player simply running around. My goal was to write an algorithm that would detect 100% of shots (including false positives), then filter the false positives. After a few explorations of the data, I found that the accelerometer data was the most useful for detecting when in a rally a shot was occuring due to the distinct peaks and shape of the data and to the following hypothesis:
"When a shot occurs there is a distinct spike in accelerometer data in each x,y,z dimension. This spike is consistently larger than at other points within the rally. Therefore, a potential shot occurs when the magnitude of the accelerometer data exceeds a threshold β1. Shot intervals are defined as the ω-temporal window between the two minima values below a threshold β2 surrounding this spike. ω must exceed a given threshold for the window of data to be classed as a potential shot."
Ultimately, as this was a personal project, I didn't have a wealth of data to train a universal model on. So I settled with (over-classified) β and ω values that satisified my data well - and most importantly, performed well when I used this device for my own shot detection.
Shot Classification
After being able to detect a shot, the next step was to classify the shot as a forehand or a backhand. To classify I would compare the test data to the training data and produce a likelihood of the shot being a forehand or a backhand. However, using a distance metric like Euclidean distance would not be able to cope with the fact that forehands and backhands can be hit at very different speeds.
Creating a comparison between two shots
To compare shots I used a Dynamic Time Warping (DTW) algorithm. This allows "measuring the similarity between two temporarl sequences which may vary in speed" - perfect for measuring forehand/backhand data collected over time where the speed of the shot might have varied.
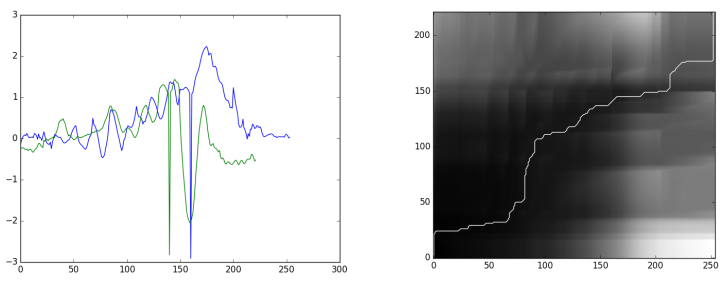
To visualize the DTW algorithm, to the left is the two temporal sequences being compared (x-axis of a forehand swing over time), and to the right is the cost matrix from the DTW algorithm and the lowest-cost path chosen.
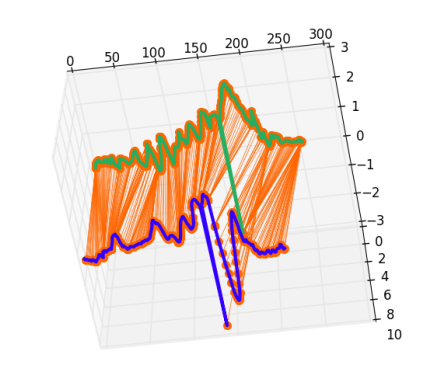
Using DTW's lowest-cost path we can map each index of the two sequences to each other. We can then calculate the distance between them to produce a cost metric. Here is a visual representation of applyting the lowest-cost path from the DTW algorithm to the two shots:
Building the classifier
The final step was to train a modal to use the output from the DTW algorithm to classify a shot as a forehand or a backhand. For this I used a K-Nearest Neighbors (KNN) algorithm on the output cost from each axis (x,y,z) of a shot to the training data. I used a repeated sub-sampling cross-validation method to test the accuracy of the model with decent results:
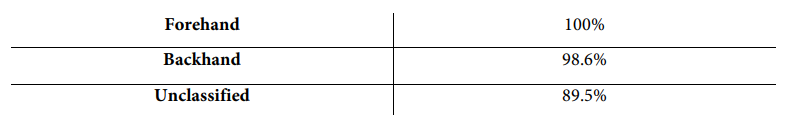
This performed incredibly well. However, as each shot was being compared to ~115 shots in each x,y,z axis, this took a long time per shot - ~13 seconds per shot running on a late 2014 Macbook Pro with dual-core i5. There are certainly many areas of improvement here, but for the purposes of this project I was happy with the results.
Shot Reconstruction
As an extended goal of this project, I decided to see if I could reconstruct a shot in a 3D space (which you can see a teaser of in the commerical video). This would allow players to see their shot in action in a virtual environment for analysis, or just for fun. I also wanted to explore potentially estimating features like shot path, shot speed and ball spin. Noise and drift from the IMU was the toughest challenge in this. However, that is a topic for another article! 😉
Lookback
This project was done in 2016. I was a student at the time and had a lot of fun with it. I learned a lot about analyzing raw data and how to use it in a real-world application. Ultimately machine learning has come a long way since then and tools like TensorFlow and PyTorch have made it much easier to build and deploy machine learning models. I would love to revisit this project someday with a bigger dataset, more knowledge in data analysis and the wealth of machine learning tools to see how it could be improved and far it could be pushed.